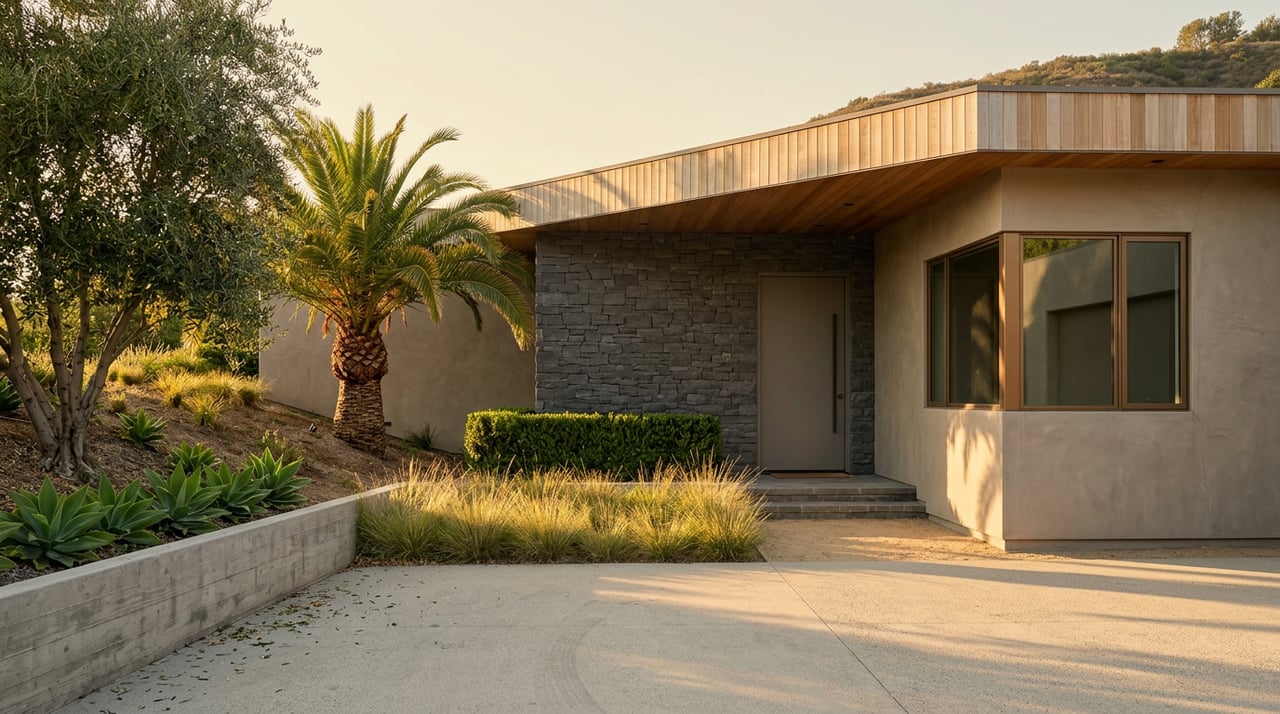
The List Price Everyone Sees vs. What West Hills Homes Actually Close At
August 13, 2026
August 13, 2026
On January 16, 1987, a group of homeowners near Fallbrook Avenue handed Los Angeles City Councilwoman Joy Picus a stack of petitions signed by 3,364 residents, representing 77 percent of the 4,333 households in the area. They wanted a new name and new boundary signs, and many expected the name change alone to add thousands of dollars to the value of their houses. Picus agreed. Two weeks later she expanded the boundary further, pulling in a swath of neighboring Canoga Park that included the Fallbrook Mall, the Platt Village shopping center, and older flatland residential tracts that had little in common with the hillside estates the original petitioners had pictured. One resident, identified in the historical record only as Schiffman, said the expansion undid the community identity the original group had fought for. Protesters gathered outside Picus's office chanting "Hell, no, we won't grow!" while a rival group caravanned through the streets urging neighbors to "Vote to Fallbrook." The boundary that resulted, and the name that came with it, is still the one printed on every listing today.
That history is worth knowing because it explains something buyers and sellers keep running into nearly forty years later: the single "West Hills" median price on a portal search describes a market that was never one market to begin with.
Right now, anyone browsing active listings in West Hills sees a number in the high $1.1 millions. Anyone pulling closed sales sees a number closer to $1.0 million. As of August 4, 2026, one listing aggregator put the median list price at $1,169,500. A snapshot five weeks earlier, on July 6, showed $1,179,000. Both sit against a trailing twelve-month closed-sale median of $1,000,000, unchanged year over year, across 220 completed transactions over that same stretch.
Redfin's own rolling three-month figure, covering the period ending May 2026, showed a median sale price of $1.1 million, with homes taking 36 days to sell on average, down from 40 days the year before. The following month, Movoto reported a median list price of just $999,000 for June 2026, down 5 percent from May and 4 percent from a year earlier, a figure that landed roughly $170,000 to $180,000 below what other aggregators were showing for list prices only weeks apart. That's less a sign of a sudden cooldown and more a sign of how differently each source slices the same pool of listings.
The same gap was already visible earlier in the year. Data for April 2026 put the median list price at $1,199,000 against a median sold price of $1,000,000, and a separate read for the same window showed a median list price of $1,174,333 against a median sale price of $1,033,333. The spread hasn't been a one-month blip. It's been the default condition through most of 2026.
| Source | As of | Median list | Median sold |
|---|---|---|---|
| Listing aggregator | August 4, 2026 | $1,169,500 | — |
| Listing aggregator | July 6, 2026 | $1,179,000 | — |
| Movoto | June 2026 | $999,000 | — |
| Redfin (3-month trailing) | May 2026 | — | $1.1M |
| Listing data | April 2026 | $1,199,000 / $1,174,333 | $1,000,000 / $1,033,333 |
| Trailing 12-month closings | through early August 2026 | — | $1,000,000 |
Every list-price figure clusters $150,000 to $200,000 above every sold-price figure, with one outlier that undercuts the rest by roughly the same margin. Neither number is wrong. They're measuring different moments in the same negotiation.
A gap this consistent usually means sellers are pricing against each other's asking prices, not against what neighbors actually accepted at the closing table. That's a reasonable response to genuine uncertainty about where the market sits this month, but it's a trap for anyone using an active listing as their reference point.
For buyers, this means the number on a listing tells you what a seller hopes the market will bear, not what it has recently borne. For sellers, it means a pricing conversation has to start with closed escrows from the past few weeks, not with what three other houses on the same street are currently asking. Pricing off other actives compounds the gap instead of closing it.
The second reason a single West Hills number misleads is geographic, not psychological. Under one MLS neighborhood name sit distinct tracts built across different decades, at different elevations, by different builders, several of them tracing back to that 1987 boundary fight.
| Typical price band | Typical footprint | |
|---|---|---|
| Monte Vista | $1.0M – $1.5M+ | 3,000 – 4,400+ sq ft, hillside view lots |
| Stone Gate | $990K – $2.2M | 2,200 – 5,900 sq ft, adjacent to Bell Canyon |
| The Estate Collection | $1.1M – $1.6M | 3,300 – 4,359 sq ft |
| Valley Circle Estates | $925K – $1.45M | mid-sized single-family lots |
| Country Hills Estates | $799K – $1.3M | 1,800 – 3,200 sq ft |
| Hidden Lake | $500K – $1.5M | gated, built around Lees Lake |
| Remington Place | $700K – $999K | 49-home community with a shared dog park |
| West Hills Townhomes (Sherman Way and Shoup) | $220K – $475K | attached townhome product |
These bands reflect typical recent listing and sale activity in each pocket rather than a single month's snapshot, and they move on their own timeline independent of whatever the citywide median happens to be doing. A "typical West Hills home" is close to meaningless until you know which of these you're standing in. A Monte Vista estate on a two-acre cul-de-sac and a townhome off Shoup Avenue share a listing name and almost nothing else.
A citywide median blends hillside view estates with flatland townhomes that were annexed for retail access rather than residential character. When the mix of what's actively listed shifts even slightly, toward more Monte Vista and Stone Gate inventory one month or more Remington Place and townhome inventory the next, the reported median moves for reasons that have nothing to do with what any specific house is worth. That's a large part of why the list-price figures above wandered by nearly $200,000 across sources measuring the same few weeks.
Why do different portals show such different numbers for the same neighborhood in the same month? Each portal pulls from a different slice of active inventory at a different moment and blends home types and pockets differently. That's how Movoto's June 2026 list median came in roughly $170,000 to $180,000 below what other aggregators showed only weeks earlier for the same area.
Should I price my home to the list-price cluster or the sold-price cluster? Sold, every time. A buyer's lender and appraiser will be working from recent closed comps regardless of what the sign says, and pricing to hope rather than to precedent tends to show up later as a longer time on market.
Does the 1987 boundary decision still affect prices today? The boundary itself doesn't set price. What it did was fold genuinely different housing stock, hillside estates and flatland retail-adjacent tracts, under one shared name, which is why a single "West Hills" figure still has to be read pocket by pocket rather than taken at face value.
Pricing a home, or a purchase, in a neighborhood built from eight different housing markets wearing one name takes more than pulling the median off a portal. If you want a read on which pocket a specific property actually sits in and what that means for your number, Burstein LA Homes is a good place to start that conversation. Schedule a Consultation whenever you're ready to talk specifics.
Connect with a real estate professional who values trust, insight, and personal attention. Every step is guided by a deep understanding of what “home” truly means.